Transcriptomics
Transcriptomics · RNA-seq & aberrant events
From cohort structure to differential expression, splicing and functional interpretation, using complementary views rather than a single plot.
Bulk RNA-seq
Quality control, quantification, normalisation, sample exploration, covariate assessment, differential expression and multiple-testing correction.
- PCA and cohort structure
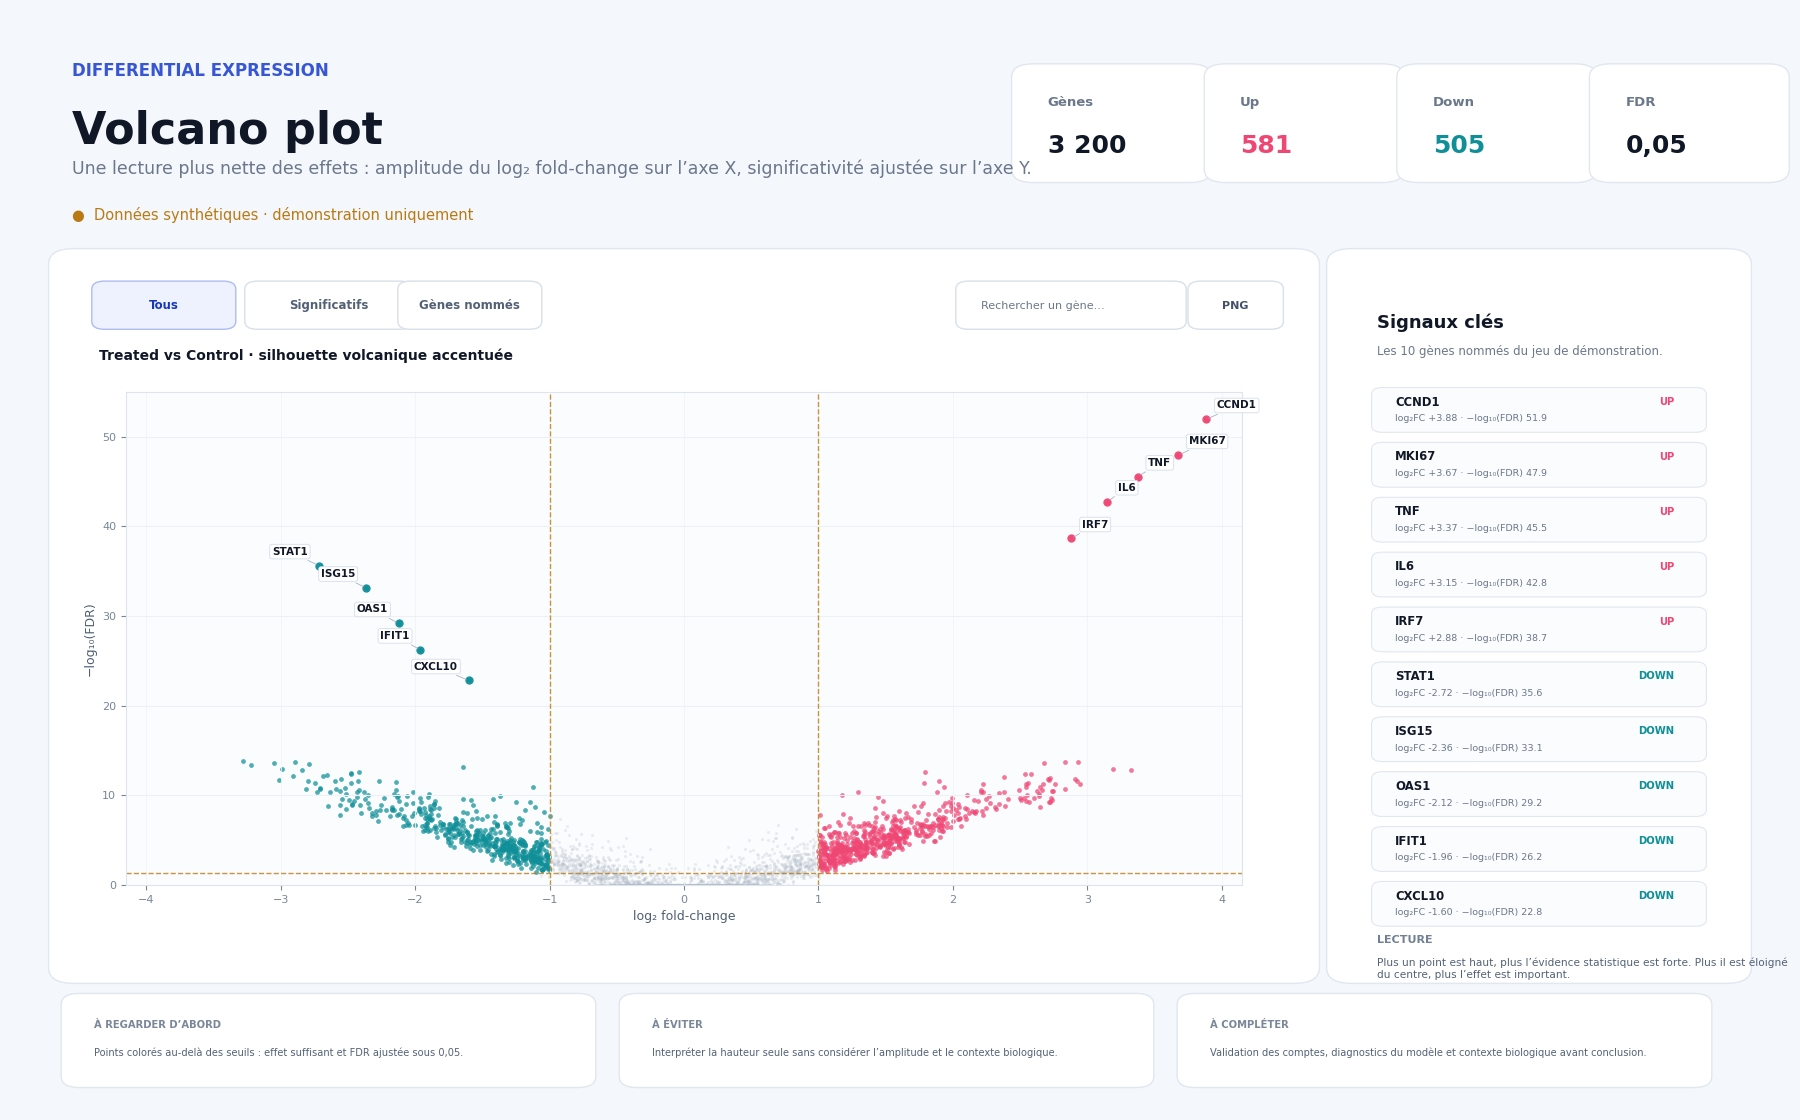
- Heatmap, volcano and MA plot
- Complete differential tables
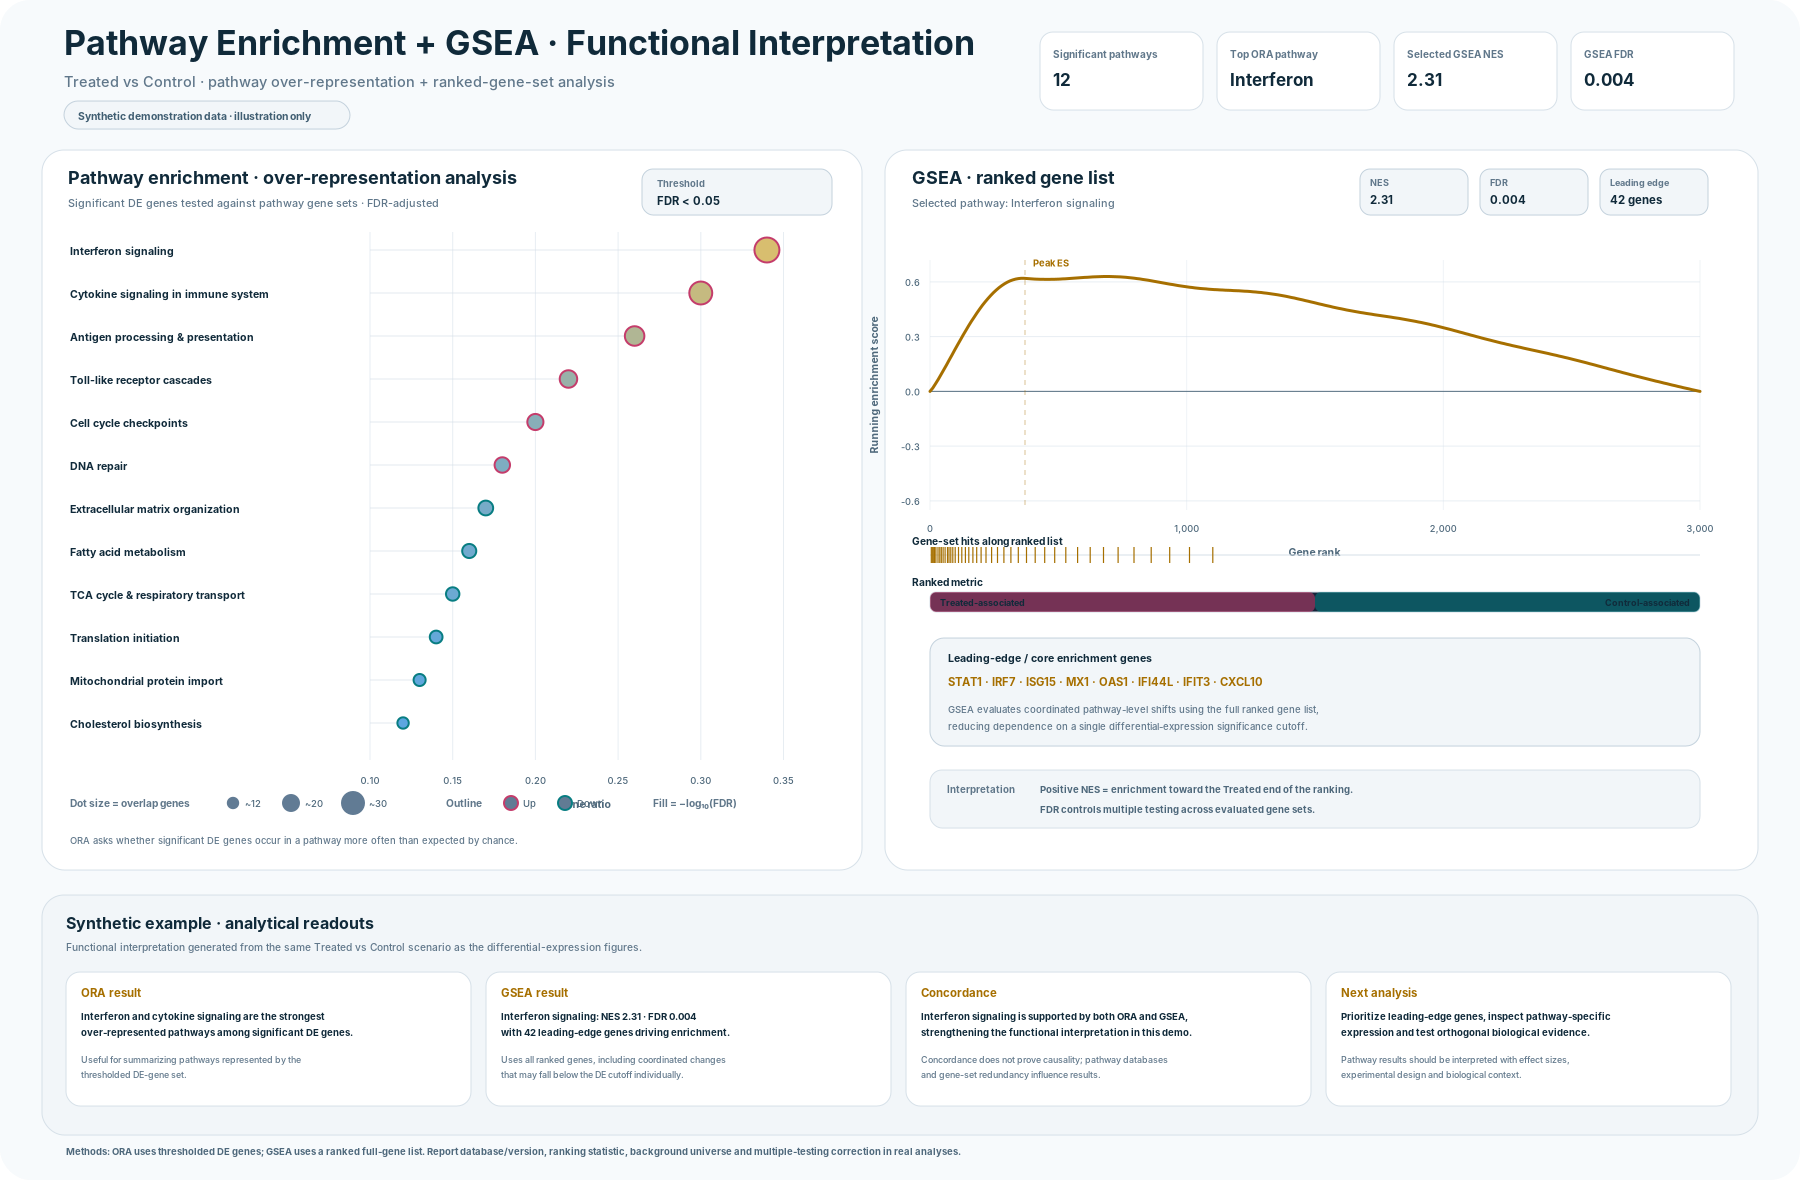
- Functional enrichment and GSEA
Expression outliers & aberrant splicing
Individual-level analysis to identify atypical expression signals or candidate splicing events relative to an appropriate cohort or reference set.
Functional interpretation
Pathway enrichment and GSEA connect transcriptomic signals with biological processes while retaining effect direction, FDR and leading-edge context.
Results provided
Expression matrices, result tables, QC and comparison figures, functional analyses, methods, scientific summary and interactive reporting.
Reporting examples
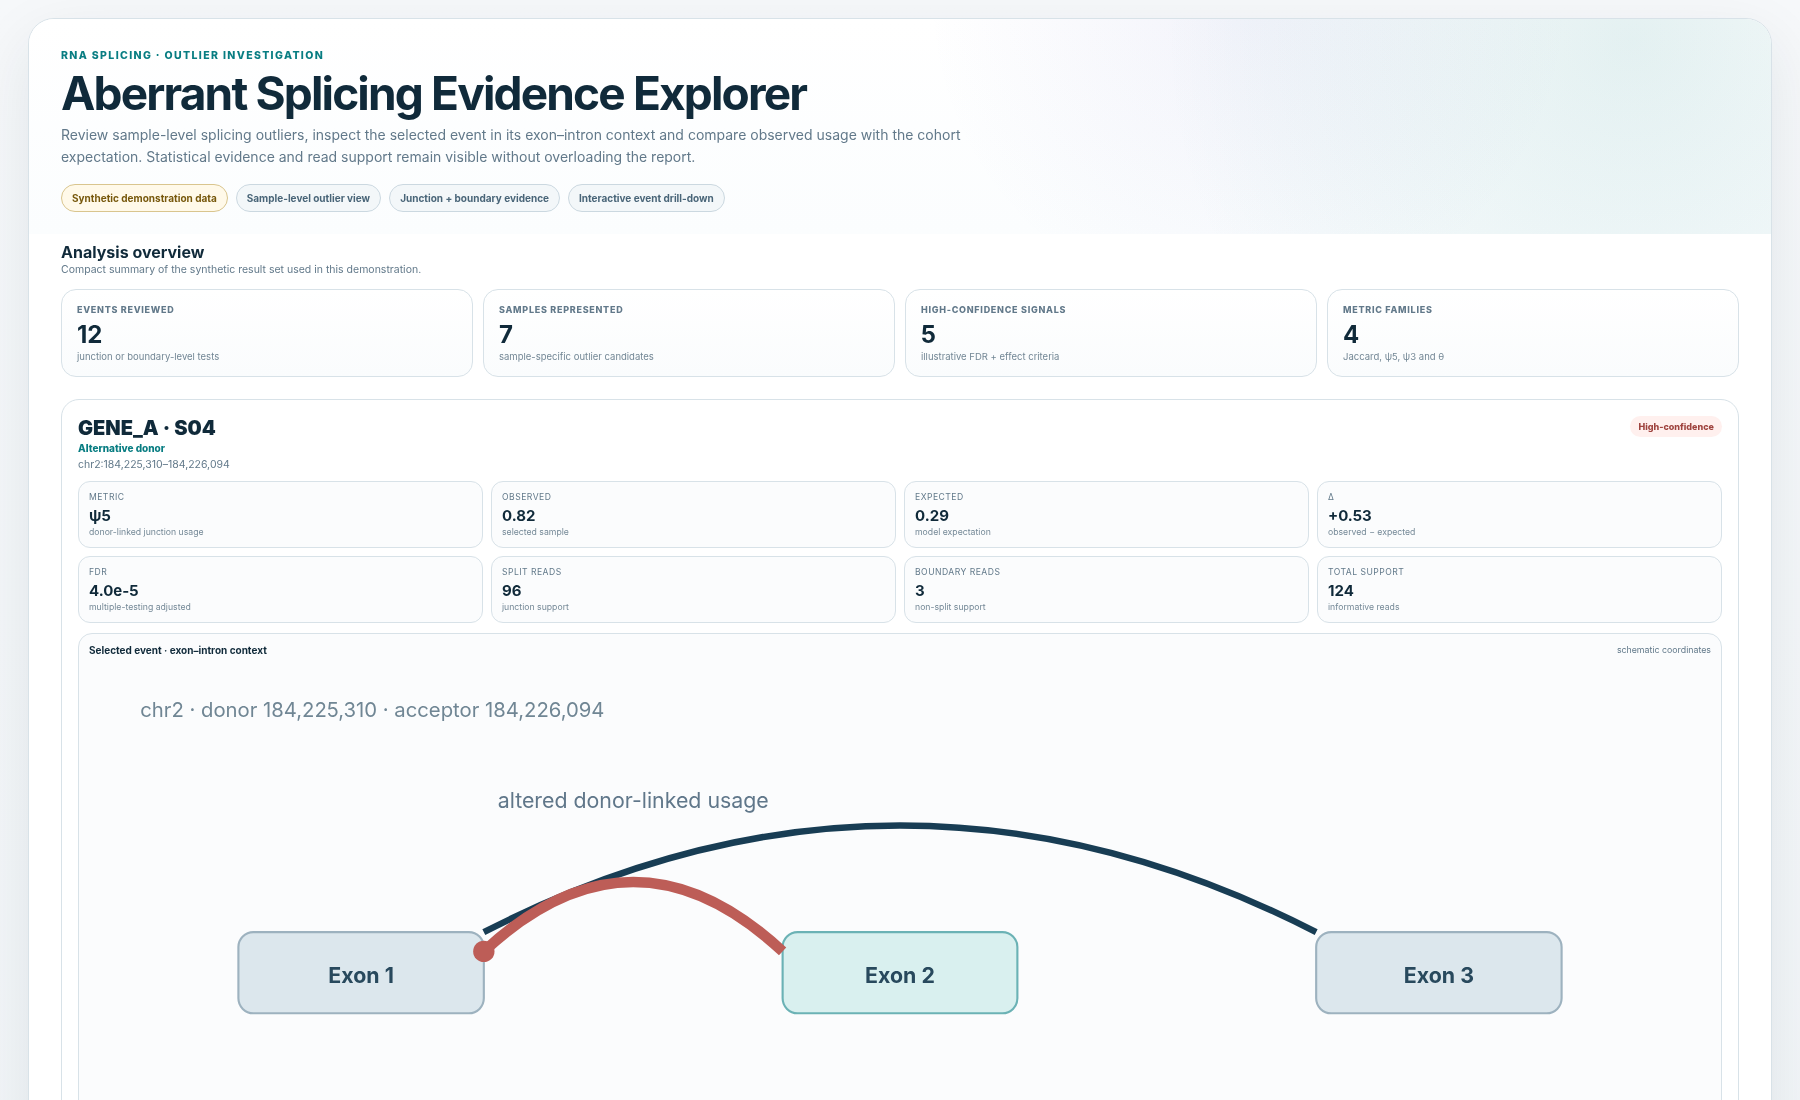
Aberrant splicing
Selected event, observed/expected metric, FDR, read support and exon–intron schematic.
Explore example →